Video 3 of 7 · 4:32 · Watch in order
Video 3: Network Diagram in AutoCAD
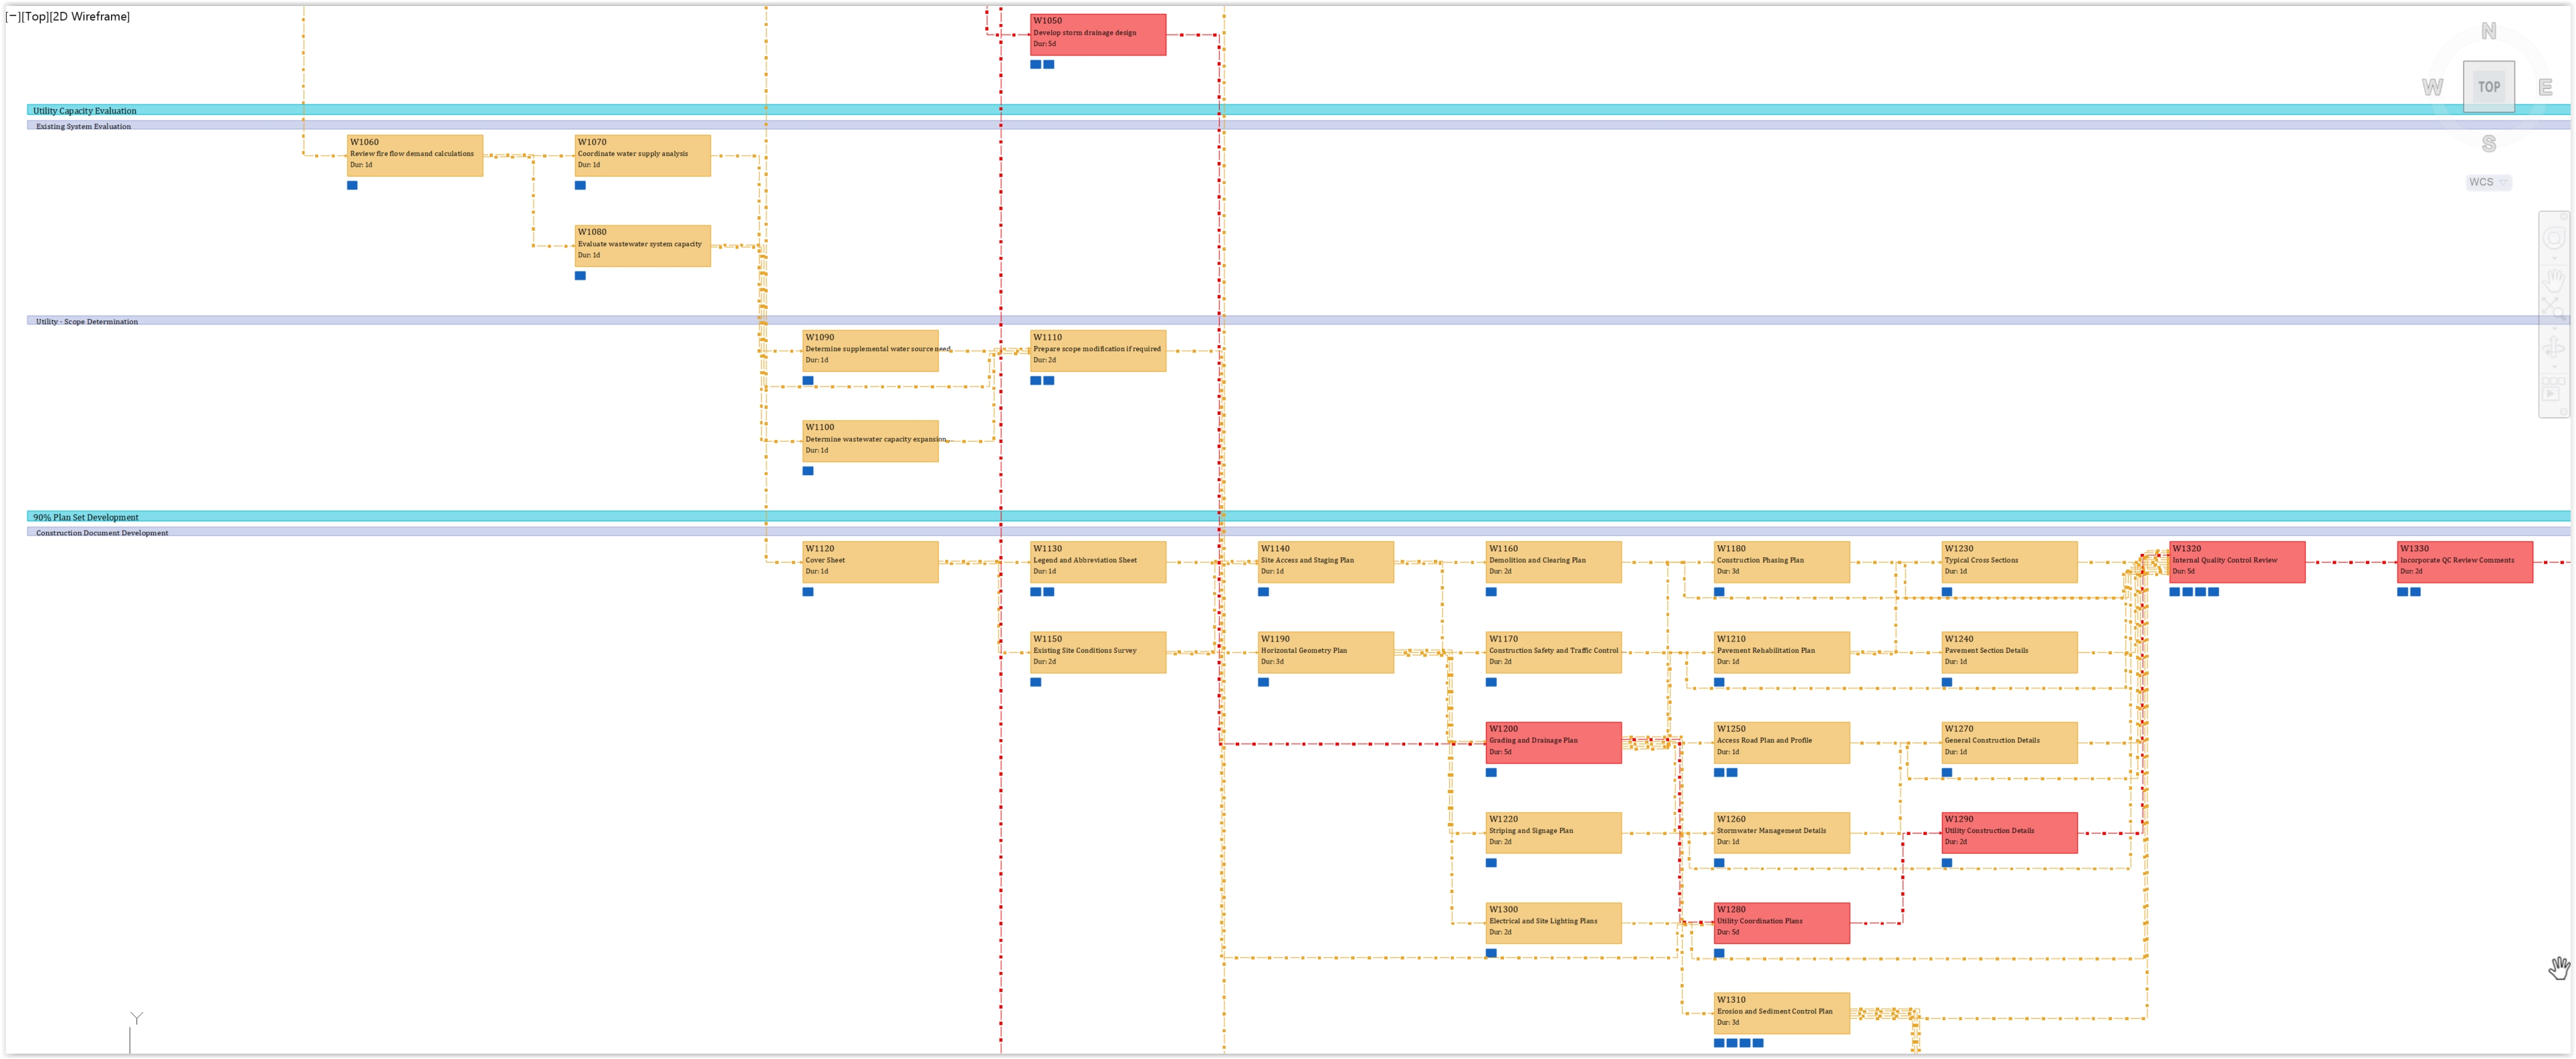
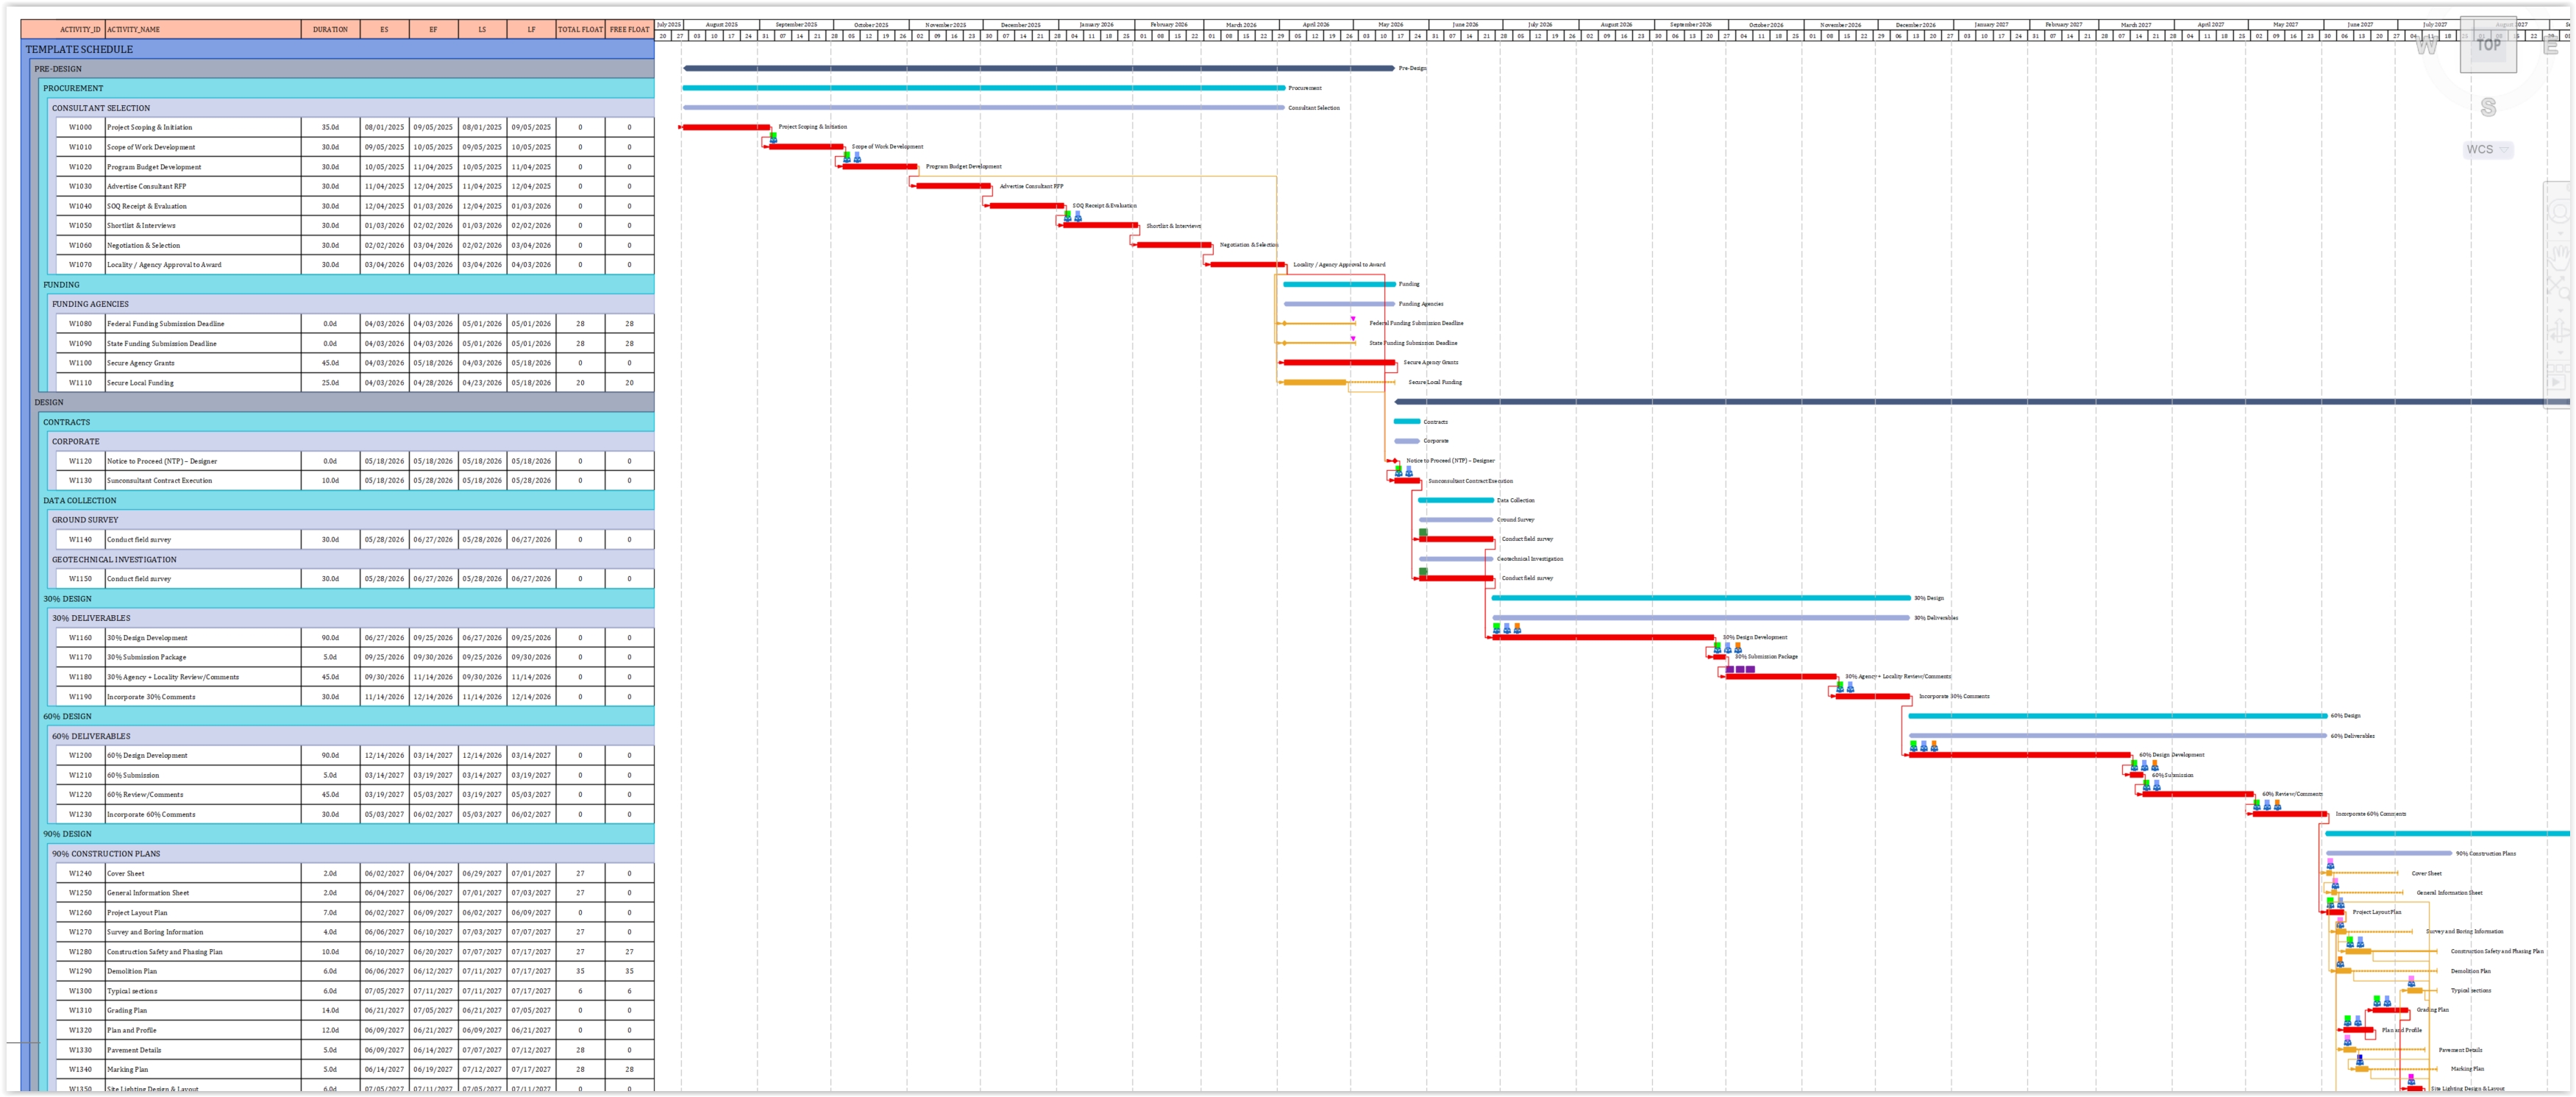
Every CPMCAD schedule can be drawn as a Precedence Diagram Method network directly in your AutoCAD drawing, with the critical path visually distinct from activities that carry float.
How to read a network diagram in AutoCAD
- Generate the network diagram from your calculated schedule. Once the CPM engine has run, CPMCAD can draw a Precedence Diagram Method network as native AutoCAD lines, polylines, text, and blocks, the same entity types you would draw yourself.
- Read the node data. Each activity node shows its Early Start, Early Finish, Late Start, and Late Finish dates, so you can see exactly how the forward and backward pass produced that activity's position in the schedule.
- Follow the critical path. Activities with zero Total Float are visually distinguished from the rest of the network, giving you an immediate read on where the schedule has no flexibility to absorb delay.
- Trace relationship lines and lags. Finish to Start, Start to Start, Finish to Finish, and Start to Finish relationships are drawn with their lag values, so a five day Start to Start lag or a negative Finish to Finish lag is visible on the diagram itself.
- Use standard AutoCAD tools on the output. Because the network is native geometry, you can select any node in the Properties palette, move it, change its layer, or adjust the text, exactly as you would with anything else you draw in AutoCAD.
- Organize and plot by layer. CPMCAD separates bars, text, relationships, and critical path elements onto distinct layers, so you can isolate the critical path, hide relationship lines for a cleaner plot, or match your company's color standards.
What you will see in the video
Video overview (from the production script)
Everything CPMCAD draws in AutoCAD is standard geometry: lines, polylines, text, and blocks. Selecting an activity node shows it in the Properties palette just like anything else you would draw, so every AutoCAD tool you already know works on the schedule output.
The network diagram follows the Precedence Diagram Method. Each node represents an activity, with its Early Start, Early Finish, Late Start, and Late Finish dates from the forward and backward pass. Critical path activities, those with zero Total Float, are visually distinguished from non-critical activities that carry float.
Relationship lines connect the nodes according to their logic type: Finish to Start lines run from the end of a predecessor to the start of its successor, Start to Start lines connect the starts, and Finish to Finish lines connect the finishes, each reflecting any lag or lead defined in the Excel data.
Milestones, activities with zero duration, are drawn as distinct symbols rather than bars or boxes, giving you visual anchors at key decision points like Notice to Proceed or a funding deadline.
The output is organized on separate layers for bars, text, relationships, critical path, and milestones, so you have full control over what plots and what doesn't. Because it is native CAD, plotting the network is the same as plotting any other drawing content, and you can XREF it into a plan set so updates propagate automatically.
Note: this summary is adapted from the production script for this video. Specific layer names and visual styling may differ from what is shown on screen.
Try it on your own schedule
CPMCAD offers a full-featured 30-day free trial, or $250/year for unlimited use and clean, watermark-free output.